                perldoc Run_vPhyloMM.pl

                perldoc vPhyloMM.pm

                perldoc vPhyloMM_GUI.pm
perl Run_vPhyloMM.pl --new=<FILENAME>
perl Run_vPhyloMM.pl --variables-file=sample_variables.txt
perl Run_vPhyloMM.pl --variables-file=sample_variables.txt --gui
DNA' and a markers file named
'markers.txt' there.minpd or
minpd.exe on Windows machines (Important! See
Installation/Sliding MinPD.pdf for instructions on setting up minpd
properly). If the Sliding MinPD executable is not in your system
path (typing minpd at the command prompt does not run
Sliding MinPD) then you will need to tell vPhyloMM where to find it
by setting the SlidingMinPD variable.
- Click on the “+” symbol to the left of
"
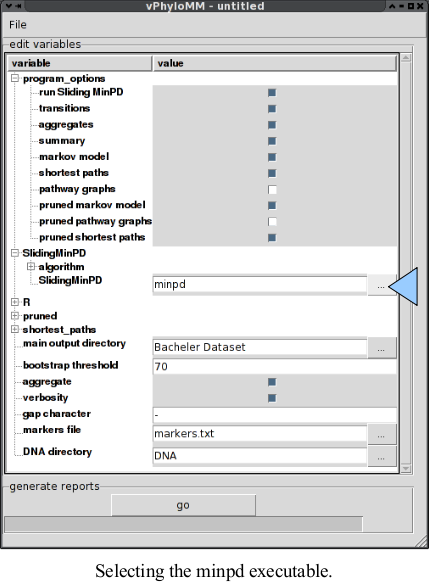
SlidingMinPD". - Type the path or click the box labled “...” and browsing there (see image below). This will be the same directory that you chose in step 5 of Sliding MinPD installation.
-
Bachelor Dataset".- Click on "
File->Save As..." - In the upper left-hand corner of the window. Choose a folder
and a name for the setting and click
Save.
- Clicking on "
File->Open..." and choose your saved file.
To enable graph drawing:
- In the GUI, check the
pathway graphsandpruned pathway graphsboxes underprogram options. - From the CLI, open the variables file and change the value
of
pathway graphsandpruned pathway graphsto '0'.
go button at the bottom to generate the selected reports.Bacheler Dataset"
directory unless you have changed the main output directory.